This report is based on input from 37 freelance technical writers. Although this is far fewer than for salaried employees it is by far the most detailed survey yet. All rates are those actually charged, not asking rates.
How Rates Were Calculated
The way rates are calculated affects the outcome. Rates below are calculated in units of rate per writer with no weight given to the number of hours each writer works. In other words Avg = (RateForA + RateForB) / NumberOfWriters.
For example, if writer A works 200 hours/mo and charges $10/hour, while writer B works 100 hours/mo and charges $20/hr the average is calculated as follows:
Avg = ($10 + $20) / 2 = $15 .
Direct Rate vs. Market Rate
Direct Rate = the rate charged by contractors who work directly with the client and does not include data from subcontractors.
Market Rate = the rate charged the client. This includes data from subcontractors who know what rate the client was charged.
Sub Rate = the rate received by the sub contractor.
Note: The rate used in the Affiliation breakdown is based on the rate received for direct and subcontract work according to the percentage of direct work reported.
Rate = (DirectRate * %Direct) = (SubRate * (1-%Direct))
Exchange Rates
Rates that were listed in NIS were converted to $USD at the April 15 exchange rate of 4.06. This is the reason that some of the percentile rate are uneven amounts (that percentile happened to be an NIS rate converted to $USD.
Although the exchange rate dropped dramatically at the start of April during the reporting period, the affect of this change will not be felt until the next report. This is because most contractor rates are set in $USD and they did not yet have time to adjust pricing. However, the drop in the value of the $USD was reflected in the equivalent $USD rates of those few whose rate is set in NIS.
Average, Median and Percentiles
Average is calculated by adding up all salaries and dividing the sum by the number of salaries reported. Average = SUM / # of entries.
Median is what is the salary for the person in the middle, with the same number of people earning the same or more as those earning that salary or less.
Percentiles are a ranking of entries with the lowest at 1 and the highest at 100.
25% salary means that 25% earn that salary or less, and 75% earn that salary or more. This is a low-end salary - most writers earn more.
50% salary means that 50% earn that salary or less, and 50% earn that salary or more. This is what the average, run-of-the-mill technical writer should expect to earn.
75% salary means that 75% earn that salary or less, and 25% earn that salary or more. This is what a writer who is the starting point for a high-end salary.
90% salary means that 90% earn that salary or less, and 10% earn that salary or more. This is a high-end salary - these figures are not included in this report, but I do have them for personal consulting.
General
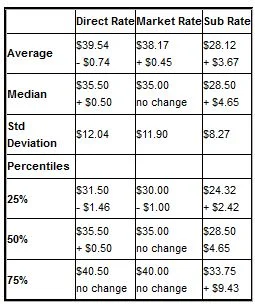
Direct RateMarket RateSub Rate
Average$39.54
- $0.74$38.17
+ $0.45$28.12
+ $3.67
Median$35.50
+ $0.50$35.00
no change$28.50
+ $4.65
Std Deviation$12.04$11.90$8.27
Percentiles
25%$31.50
- $1.46$30.00
- $1.00$24.32
+ $2.42
50%$35.50
+ $0.50$35.00
no change$28.50
$4.65
75%$40.50
no change$40.00
no change$33.75
+ $9.43
Professional Organizations
There appears to be relationship between affiliation with a professional organization and rates, but it is unclear exactly what that relationship is. The rates included both direct rates and subcontracting rates according to the percentage of direct work reported. One explanation may be that affiliated writers manage to get a higher percentage of direct work, thus increasing their rates. Another may be that subcontractors and lower paid writers are less likely to pay membership dues.
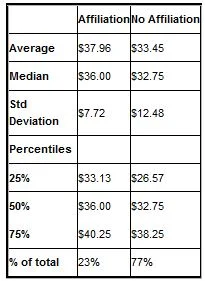
AffiliationNo Affiliation
Average$37.96$33.45
Median$36.00$32.75
Std Deviation$7.72$12.48
Percentiles
25%$33.13$26.57
50%$36.00$32.75
75%$40.25$38.25
% of total23%77%
Experience
These statistics point out some real changes since Q1. While we can see that demand for experienced writers is clearly on the rise, we also see that the influx of new writers has brought down rates even for the writers with 5-10 years experience.
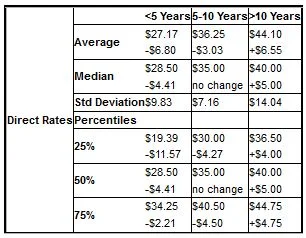

Direct Rates
<5 Years5-10 Years>10 Years
Average$27.17
-$6.80$36.25
-$3.03$44.10
+$6.55
Median$28.50
-$4.41$35.00
no change$40.00
+$5.00
Std Deviation$9.83$7.16$14.04
Percentiles
25%$19.39
-$11.57$30.00
-$4.27$36.50
+$4.00
50%$28.50
-$4.41$35.00
no change$40.00
+$5.00
75%$34.25
-$2.21$40.50
-$4.50$44.75
+$4.75
Market Rates
<5 Years5-10 Years>10 Years
Average$27.17
-$7.53$36.25
-$3.03$44.10
+$6.55
Median$28.50
-$5.93$35.00
no change$40.00
+$5.00
Std Deviation$9.83$7.16$14.04
Percentiles
25%$19.39
-$13.52$30.00
-$4.27$36.50
+$4.00
50%$28.50
-$5.93$35.00
no change$40.00
+$5.00
75%$34.25
-$2.75$40.50
-$4.50$44.75
+$4.75
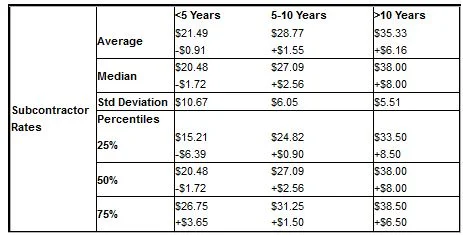
Subcontractor Rates
<5 Years5-10 Years>10 Years
Average$21.49
-$0.91$28.77
+$1.55$35.33
+$6.16
Median$20.48
-$1.72$27.09
+$2.56$38.00
+$8.00
Std Deviation$10.67$6.05$5.51
Percentiles
25%$15.21
-$6.39$24.82
+$0.90$33.50
+8.50
50%$20.48
-$1.72$27.09
+$2.56$38.00
+$8.00
75%$26.75
+$3.65$31.25
+$1.50$38.50
+$6.50
Geography
Surprisingly the 04 area is the highest paying. In order to understand this result you need to cross reference the salary reports. Higher salaries in the 03 and 09 area codes have been attracting freelance writers. In the 04 area code employers have been slower to offer higher salaries adn continue to rely on freelance writers for their top positions. This appears to be changing as rates rose dramatically in the 04 area code this quarter.
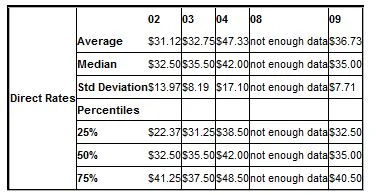

Direct Rates
0203040809
Average$31.12$32.75$47.33not enough data$36.73
Median$32.50$35.50$42.00not enough data$35.00
Std Deviation$13.97$8.19$17.10not enough data$7.71
Percentiles
25%$22.37$31.25$38.50not enough data$32.50
50%$32.50$35.50$42.00not enough data$35.00
75%$41.25$37.50$48.50not enough data$40.50
Market Rates
0203040809
Average$31.12$32.75$47.33not enough data$36.17
Median$32.50$35.50$42.00not enough data$35.00
Std Deviation$13.97$8.19$17.10not enough data$7.60
Percentiles
25%$22.37$31.25$38.50not enough data$31.50
50%$32.50$35.50$42.00not enough data$35.00
75%$41.25$37.50$48.50not enough data$39.75
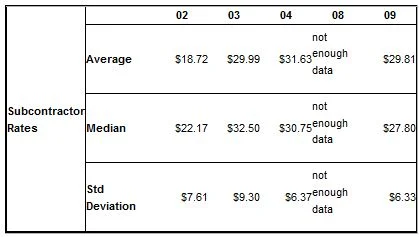
Subcontractor Rates
02 03040809
Average$18.72$29.99$31.63
not enough data
$29.81Median$22.17$32.50$30.75
not enough data
$27.80
Std Deviation$7.61$9.30$6.37
not enough data
$6.33
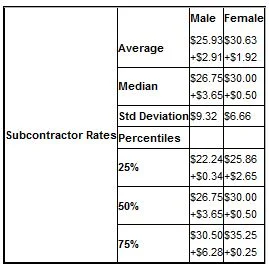
Sex
For the second quarter in a row, female contractors are earning more than their male counterparts.
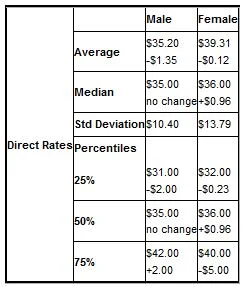
Direct RatesMale Female
Average$35.20
-$1.35$39.31
-$0.12
Median$35.00
no change$36.00
+$0.96
Std Deviation$10.40$13.79
Percentiles
25%$31.00
-$2.00$32.00
-$0.23
50%$35.00
no change$36.00
+$0.96
75%$42.00
+2.00$40.00
-$5.00
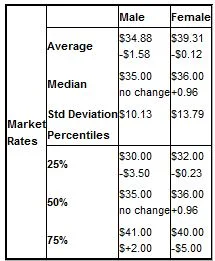
Market
Rates
Male Female
Average$34.88
-$1.58$39.31
-$0.12
Median$35.00
no change$36.00
+0.96
Std Deviation$10.13$13.79
Percentiles
25%$30.00
-$3.50$32.00
-$0.23
50%$35.00
no change$36.00
+0.96
75%$41.00
$+2.00$40.00
-$5.00
Subcontractor Rates
Male Female
Average$25.93
+$2.91$30.63
+$1.92
Median$26.75
+$3.65$30.00
+$0.50
Std Deviation$9.32$6.66
Percentiles
25%$22.24
+$0.34$25.86
+$2.65
50%$26.75
+$3.65$30.00
+$0.50
75%$30.50
+$6.28$35.25
+$0.25